
PW Developments — When reviewing a property investment proposal, occupancy projections can make a potential investment look particularly attractive. A developer may present an estimated occupancy rate, an average daily rate (ADR), and an annual revenue figure that appears to support a strong return.
Why Investors Should Question Occupancy Projections
For example, a proposal might state:
- Projected occupancy: 80%
- Average daily rate (ADR): IDR 4,000,000
- Projected annual room revenue: IDR 1.168 billion
At first glance, the numbers seem compelling. However, the fact that a projection is mathematically consistent does not automatically mean that it is commercially realistic.
For investors considering Bali property investment, particularly a villa in Uluwatu, the critical question is not simply how much revenue a property could generate under favourable assumptions. It is whether relevant market data, realistic operating conditions, and a clear explanation of the risks support those assumptions.
An occupancy rate is not a guarantee of future bookings. In other words, it is an assumption that investors need to test.
…
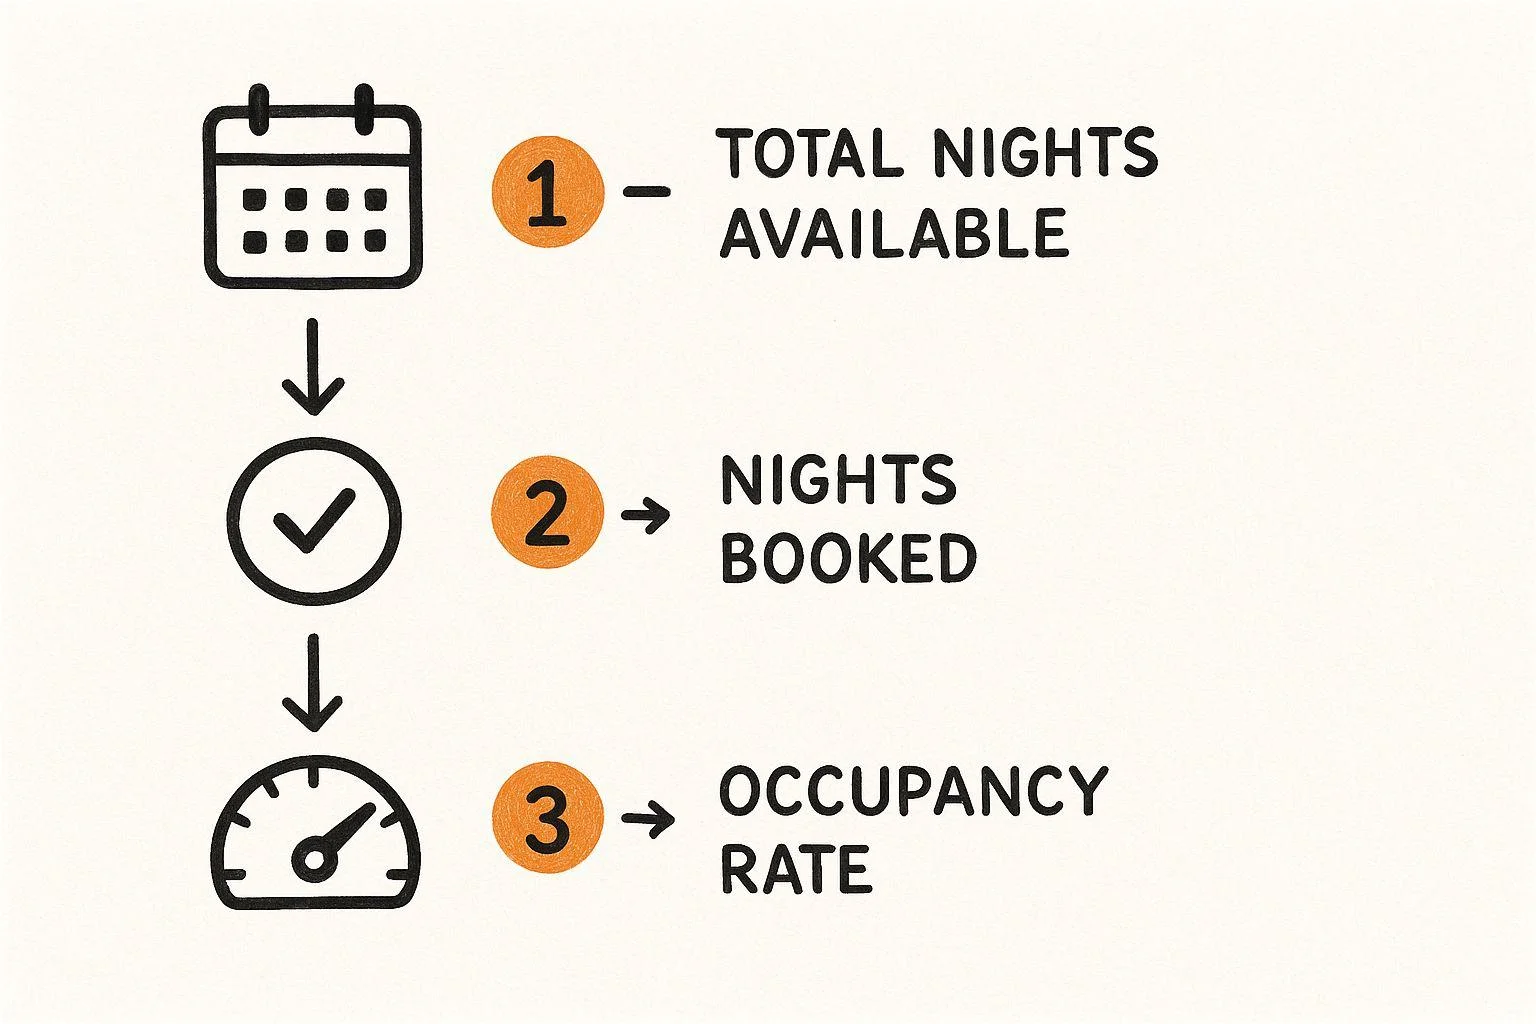
1. Understand How the Occupancy Projection Is Calculated
Occupancy rate measures the proportion of available nights that guests book during a defined period.
A simplified formula is:
Occupancy Rate = Booked Nights ÷ Available Nights × 100%
For example, suppose a villa is available for 365 nights in a year and receives bookings for 292 nights.
Its annual occupancy rate would be:
292 ÷ 365 × 100% = 80%
This calculation is straightforward. The more important question is how the developer estimated the 292 booked nights.
Does the projection come from actual operating records? Comparable villas? A third-party market report? A developer’s internal model? Or an assumption prepared for a sales presentation?
Each source provides a different level of evidence.
As a result, investors should request the underlying data, the period covered, the calculation method, and the assumptions used. If the developer cannot explain where the occupancy figure comes from, investors should treat the figure as an unverified forecast rather than established performance.
…

2. Distinguish Historical Performance From Forecasts
A property’s actual performance and its projected performance are not interchangeable.
Historical performance describes what has already happened. By contrast, a forecast estimates what may happen in the future based on selected assumptions.
Both can be useful, but the developer should present them separately.
Specifically, for an operating villa, request monthly booking records, available nights, booked nights, achieved ADR, cancellations, discounts, and revenue statements. In addition, where possible, reconcile the figures against booking-platform records and property-management reports.
However, for a villa that has not yet opened, historical operating data for that specific property will not exist. In that case, comparable properties and clearly stated assumptions should support the projection.
Moreover, a credible proposal should identify which figures are actual, which are estimates, and which rest on future expectations.
Be cautious when a presentation uses confident language or precise revenue figures without showing the evidence behind them.
…

3. Check Whether the Comparable Properties Are Truly Comparable
A developer may support an 80% occupancy projection by showing that other villas in Bali achieve similar results. However, Bali is not a single, uniform rental market.
As discussed in the earlier articles in this series, Uluwatu itself consists of different micro-markets. Properties in Bingin, Pecatu, Padang-Padang, Balangan, Ungasan, and other nearby areas can have different demand patterns, access conditions, competitive supply, and guest profiles.
In fact, even within the same neighbourhood, two villas may perform differently.
A meaningful comparison should consider:
- Micro-location: Is the comparable property in the same neighbourhood, or merely somewhere in Bali?
- Property type: Is it a one-bedroom villa, a family villa, a luxury estate, or a multi-unit development?
- Guest capacity: Can it accommodate a similar number of guests?
- Quality and amenities: Are the design, privacy, pool, facilities, and overall guest experience comparable?
- Accessibility: Are beach access, restaurants, transport, and other attractions similarly convenient?
- Rental positioning: Does it target budget-conscious travellers, couples, families, or high-end guests?
- Operating model: Does it use professional management, a branded hospitality operator, or self-management?
- Data period: Did the developer record the results during the same period and under similar market conditions?
A high-end villa with a strong brand and a long booking history may not offer a suitable benchmark for a new property that has no track record.
Therefore, ask for the names or identifiers of comparable properties, the measurement period, and the selection method, where the developer can disclose them. If the data is anonymised, request enough detail to evaluate whether the comparison is meaningful.
Above all, the goal is not to find the most impressive comparable property. It is to find the most relevant one.
…

4. Analyse Seasonality Instead of Relying on an Annual Average
An annual occupancy rate can hide substantial fluctuations throughout the year.
A villa may perform strongly during peak travel periods but experience weaker demand during quieter months. If an investment model assumes consistent occupancy every month, it may overstate the reliability of its projected cash flow.
Official statistics demonstrate why seasonality deserves attention. According to the Bali provincial statistics agency, the room occupancy rate for star-rated hotels was 60.88% in December 2025, compared with 57.97% in November and 69.54% in August 2025.
These figures refer to hotels with star ratings across Bali, not villa rentals in Uluwatu. Therefore, investors should use them as broad tourism context rather than a direct benchmark for a specific villa.
▶ Source : BPS-Statistics Indonesia, Bali Province — Tourism Overview, December 2025.
Investors should request monthly occupancy and revenue assumptions rather than relying exclusively on one annual percentage.
A useful forecast should account for:
- Peak and low seasons
- Monthly changes in average daily rates
- Booking lead times and length of stay
- Weekday and weekend demand, where relevant
- Maintenance closures and owner-use periods
- Cancellation rates and booking changes
- Changes in competing accommodation supply
The relevant question is not whether the villa can achieve high occupancy in its strongest months. It is whether its annual performance remains viable after accounting for weaker periods.
…

5. Verify the Average Daily Rate (ADR)
Occupancy alone does not determine rental revenue. The average daily rate is equally important.
ADR generally measures room revenue earned per booked night. Investors should confirm how a developer defines it, especially whether the figure includes or excludes discounts, cleaning fees, taxes, and booking-platform fees.
Consider two hypothetical villas:
| Metric | Villa A | Villa B |
|---|---|---|
| Annual available nights | 365 | 365 |
| Occupancy | 80% | 60% |
| ADR | IDR 4 million | IDR 5 million |
| Approx. booked nights | 292 | 219 |
| Indicative annual room revenue | IDR 1.168 billion | IDR 1.095 billion |
In this simplified illustration, Villa A generates higher annual room revenue despite charging a lower nightly rate, because its occupancy is higher.
However, this comparison does not establish which investment is better. Acquisition cost, operating expenses, management fees, capital expenditure, lease term, and other factors can materially change the outcome.
Investors should also check whether the proposed ADR reflects rates actually achieved by comparable properties or merely advertised nightly prices. Indeed, published rates do not necessarily equal realised revenue: properties may offer discounts, experience cancellations, or remain unbooked at the advertised price.
Request evidence of achieved ADR over a representative period, not only screenshots of high nightly rates.
…

6. Recalculate the Revenue Projection Independently
Once investors have reviewed the occupancy and ADR assumptions, they can test the revenue calculation themselves.
A simplified model is:
Annual Gross Room Revenue = Available Nights × Occupancy Rate × ADR
Using the example above:
365 × 80% × IDR 4,000,000 = IDR 1.168 billion
The arithmetic is correct. But it depends on the assumptions being reasonable and consistently defined.
The developer should label this figure gross room revenue if it represents accommodation revenue before operating expenses. At the same time, investors should not automatically treat it as net income, profit, or the amount they will receive.
A more complete model should separately account for booking-platform commissions, management fees, cleaning and laundry, utilities, maintenance, pool and garden services, staff, marketing, insurance, replacement of furniture and equipment, taxes, and appropriate operating reserves.
Investors should also clarify how the developer treats cancelled bookings, refunds, discounts, owner stays, blocked nights, and maintenance closures.
A revenue projection is useful only when its inputs and exclusions are transparent.
…

7. Ask Whether the Occupancy Figure Reflects Real Availability
Occupancy percentages can be misleading when the definition of available nights is unclear.
For example, a villa might be physically available for 365 nights, but the owner may block several weeks for personal use or maintenance. The developer may market another property only during selected months.
If the denominator changes, the reported occupancy rate may change even when the number of nights booked remains the same.
Investors should ask:
- Does the developer calculate occupancy against all calendar nights or only nights it offers for booking?
- Does the calculation exclude owner-use periods?
- Does it also exclude maintenance closures?
- Does it distinguish blocked calendar dates from confirmed bookings?
- Does the report cover all listings, or only properties that received at least one booking?
- Is the occupancy figure a property-level result or a market average?
Third-party data providers may use different methodologies. For example, AirDNA’s explanation of occupancy rate describes its approach using booked nights and active listing nights. Similarly, investors should read the methodology behind any dataset used in a proposal and avoid comparing figures calculated on incompatible bases.
This is particularly important when comparing a developer’s forecast with market-wide short-term rental statistics.
…

8. Separate Occupancy From Net Operating Performance
A high occupancy rate does not automatically produce a high investment return.
A property can attract many bookings but still underperform if it relies on discounts, has high operating costs, or requires substantial ongoing maintenance.
Investors should assess the following metrics together:
- Occupancy rate: The share of available nights that guests book.
- ADR: The average room rate achieved per booked night, according to the stated methodology.
- RevPAR: Revenue per available room or unit-night, generally calculated as room revenue divided by available room-nights. Definitions may vary by dataset.
- Gross rental revenue: Rental revenue before operating expenses.
- Net operating income (NOI): Operating revenue less relevant operating expenses, using a clearly defined accounting basis.
- Net yield and investor-level return: Measures that depend on the relevant capital invested and, for investor-level returns, potentially financing, taxes, capital expenditure, and exit costs.
For a more detailed explanation of gross yield and net yield, see the previous article in this series: “Gross Yield vs Net Yield: What Bali Property Investors Should Really Calculate.”
Investors should treat occupancy as one input in an investment model, not as a substitute for the full financial analysis.
…

9. Test the Projection Under Different Scenarios
An investor should not rely on a single optimistic forecast. A more robust approach is to test how the investment performs when important assumptions change.
Consider the following illustrative scenario for a villa with 365 available nights and an ADR of IDR 4 million.
| Scenario | Occupancy | Booked nights (approx.) | Gross room revenue (approx.) |
|---|---|---|---|
| Optimistic | 80% | 292 | IDR 1.168 billion |
| Base case | 65% | 237 | IDR 948 million |
| Conservative | 50% | 183 | IDR 730 million |
These figures are simplified examples, not market forecasts for Uluwatu or a prediction of any specific property’s performance. They assume the same ADR and full-year availability in each scenario; an actual analysis should also test changes in ADR, expenses, and availability.
Consequently, the difference between the optimistic and conservative cases is significant. At 50% occupancy, the illustrative gross room revenue is approximately IDR 438 million lower than at 80% occupancy, before deducting any operating costs.
Furthermore, a useful sensitivity analysis should test several variables independently and together:
- Lower occupancy than projected.
- Lower achieved ADR due to competition or discounting.
- Higher management, maintenance, or utility costs.
- Greater seasonality or longer booking gaps.
- Additional capital expenditure or unexpected repairs.
- Changes in the property’s availability or operating arrangements.
Investors should then examine whether the project remains financially viable in the base and conservative cases, not only in the optimistic scenario.
…

10. Evaluate Who Is Responsible for Delivering the Forecast
A projection is only as useful as the operating plan behind it.
Ask who will manage the property, who will set rates, how the team will market the property, which booking channels it will use, and how it will measure performance after launch.
A professional management plan should also explain its pricing strategy, distribution channels, guest services, maintenance procedures, reporting frequency, fee structure, and approach to low-season demand.
If the project relies on a future operator or a proposed hospitality brand, investors should distinguish an established operating track record from a plan that the team has not yet implemented.
Where a developer or operator presents historical results from other properties, ask whether the same team achieved those results in a comparable location, with similar property specifications and under a comparable operating model.
Also confirm whether any occupancy guarantee is contractual or simply a marketing statement. Next, review the exact terms, exclusions, duration, responsible party, and remedies with an appropriately qualified legal adviser. Overall, investors should not mistake a forecast for a guaranteed return.
…

11. A Practical Checklist Before Accepting an Occupancy Projection
Before relying on an occupancy figure in a Bali villa investment proposal, investors should ask the developer for clear answers to the following questions:
- What source supports the occupancy assumption?
- Does the figure represent actual historical performance, a market benchmark, or a forecast?
- What period does the data cover?
- Are the comparable properties located in the same micro-market and positioned similarly?
- Does the model include monthly seasonality?
- Is the ADR based on achieved rates or advertised prices?
- How are cancellations, discounts, owner stays, and blocked nights treated?
- Does the developer define the available nights consistently?
- Which operating expenses does the revenue projection exclude?
- Who will manage the villa, and what evidence supports the operating plan?
- What happens to projected returns if occupancy or ADR is lower than expected?
- Can the developer provide a transparent model that investors can independently review?
A reliable proposal should make it possible to understand the assumptions, reproduce the calculations, and challenge the forecast without relying solely on the developer’s conclusions.
…

Final Thoughts
Occupancy projections can help investors understand the potential of a Bali property investment, but investors should never accept them without examining the evidence behind them.
A credible assessment looks beyond a single percentage. It considers the source and quality of the data, comparable properties, micro-location, seasonality, achieved ADR, operating availability, expenses, management capability, and downside scenarios.
For investors evaluating Uluwatu property investment opportunities, this discipline is especially important because properties in the same broader destination may have different competitive positions and rental performance.
At PW Developments (Pillai Ward), we believe a more informed investment decision begins with asking better questions. A compelling projection may be a useful starting point, but transparent assumptions and realistic financial analysis are what allow investors to evaluate an opportunity with greater clarity.
The key principle is simple: Do not ask only how much a property could earn under the proposed forecast. Ask what evidence supports that forecast, what could cause it to underperform, and whether the investment remains viable if the assumptions change.
— Published by Marketing Team of Pillai Ward
1. BPS Bali — Tourism Overview, December 2025
2. BPS Indonesia — Occupancy Rate of Hotel Room 2025
3. AirDNA — How Occupancy Rate Is Calculated
4. AirDNA — How Revenue Is Calculated
5. Bali Tourism Statistics — Bali Provincial Tourism Office
~Thank you.